Have you Mapped Your Value Streams?
An often overlooked and underutilized lean tool is the value stream map (VSM). In simple terms, the VSM provides a “30,000-foot view” of the flow of goods from supplier to customer through your organization. The primary purpose of creating a value stream map is to show where you can improve your process by visualizing both its value-adding and wasteful steps. Value stream mapping encourages systems thinking, resulting in better communication, more effective collaboration, and more team wins.
The VSM allows decision makers to clearly visualize the current state of the process and problems like process delays, quality issues, excessive downtime, constraints and inventory issues. These are all things that prohibit product or information flow. When flow stops, costs increase, and both internal and external customers experience delays.
As facilitators, we often find the most “value” in value stream mapping is being able to help a company see and understand their whole process (value stream). Before a value stream mapping session, each team member only understands their part of the process. Without fail, each new VSM team goes through a short period of “I didn’t know we did that”. As the VSM is developed, the team focuses on optimizing the whole value stream instead of improving their sections. The VSM process allows a team to focus on lead times as opposed to cost reductions and helps prioritize kaizen efforts aimed at making a bigger impact for your customers. Value Stream Mapping drives your continuous improvement teams toward customer focused impacts that truly lead to bottom line results.
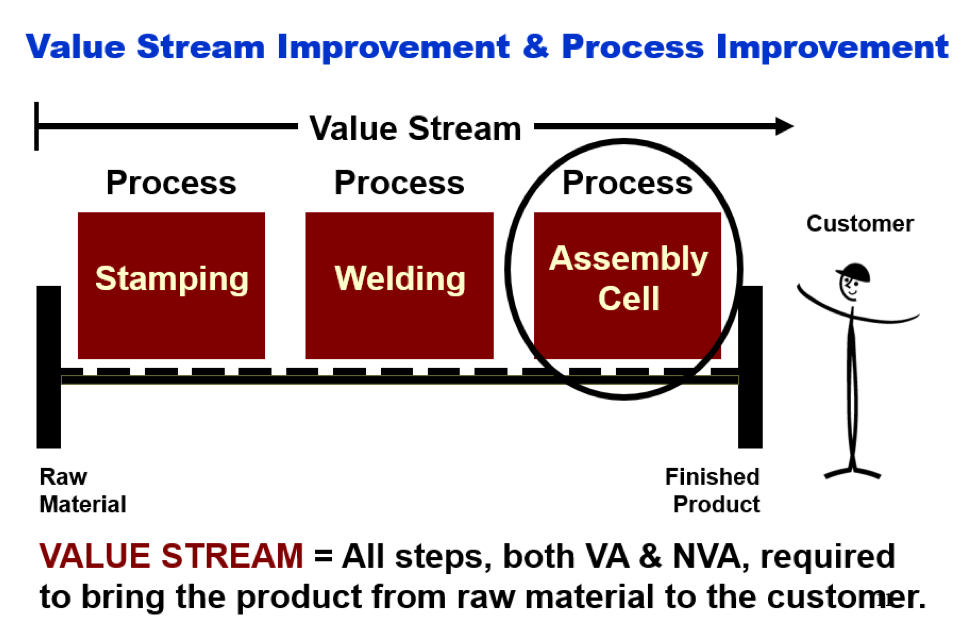
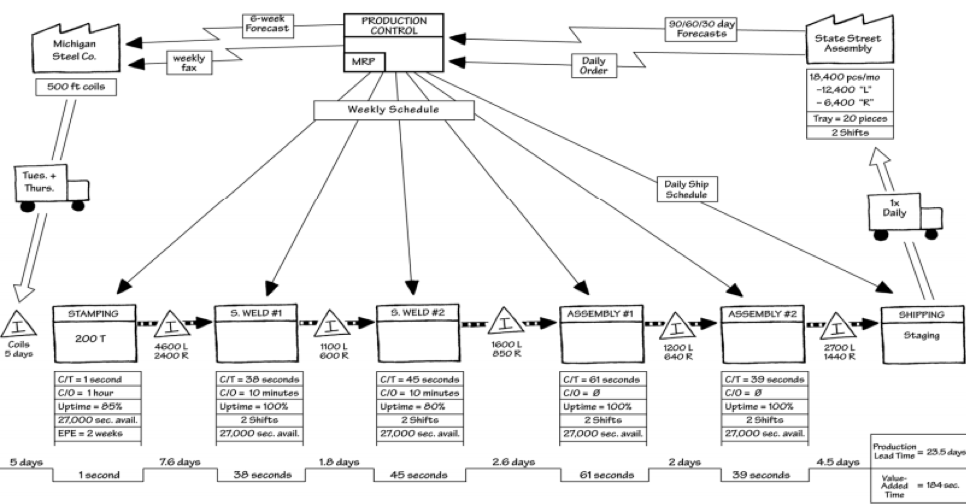
An important distinction to note is the difference between Value Stream Mapping and Process Mapping. Keep in mind, the VSM provides the “30,000-foot view” where the process map provides the “1,000-foot view”. The figures below help illustrate this point. Figure one is a full value stream map for a defined product. This VSM shows product flow from raw material through finished product with pertinent process data and the information flow. Figure two shows how we could use process mapping to focus on one assembly cell.
1: Value Stream Map
2: VSM vs. Process Map